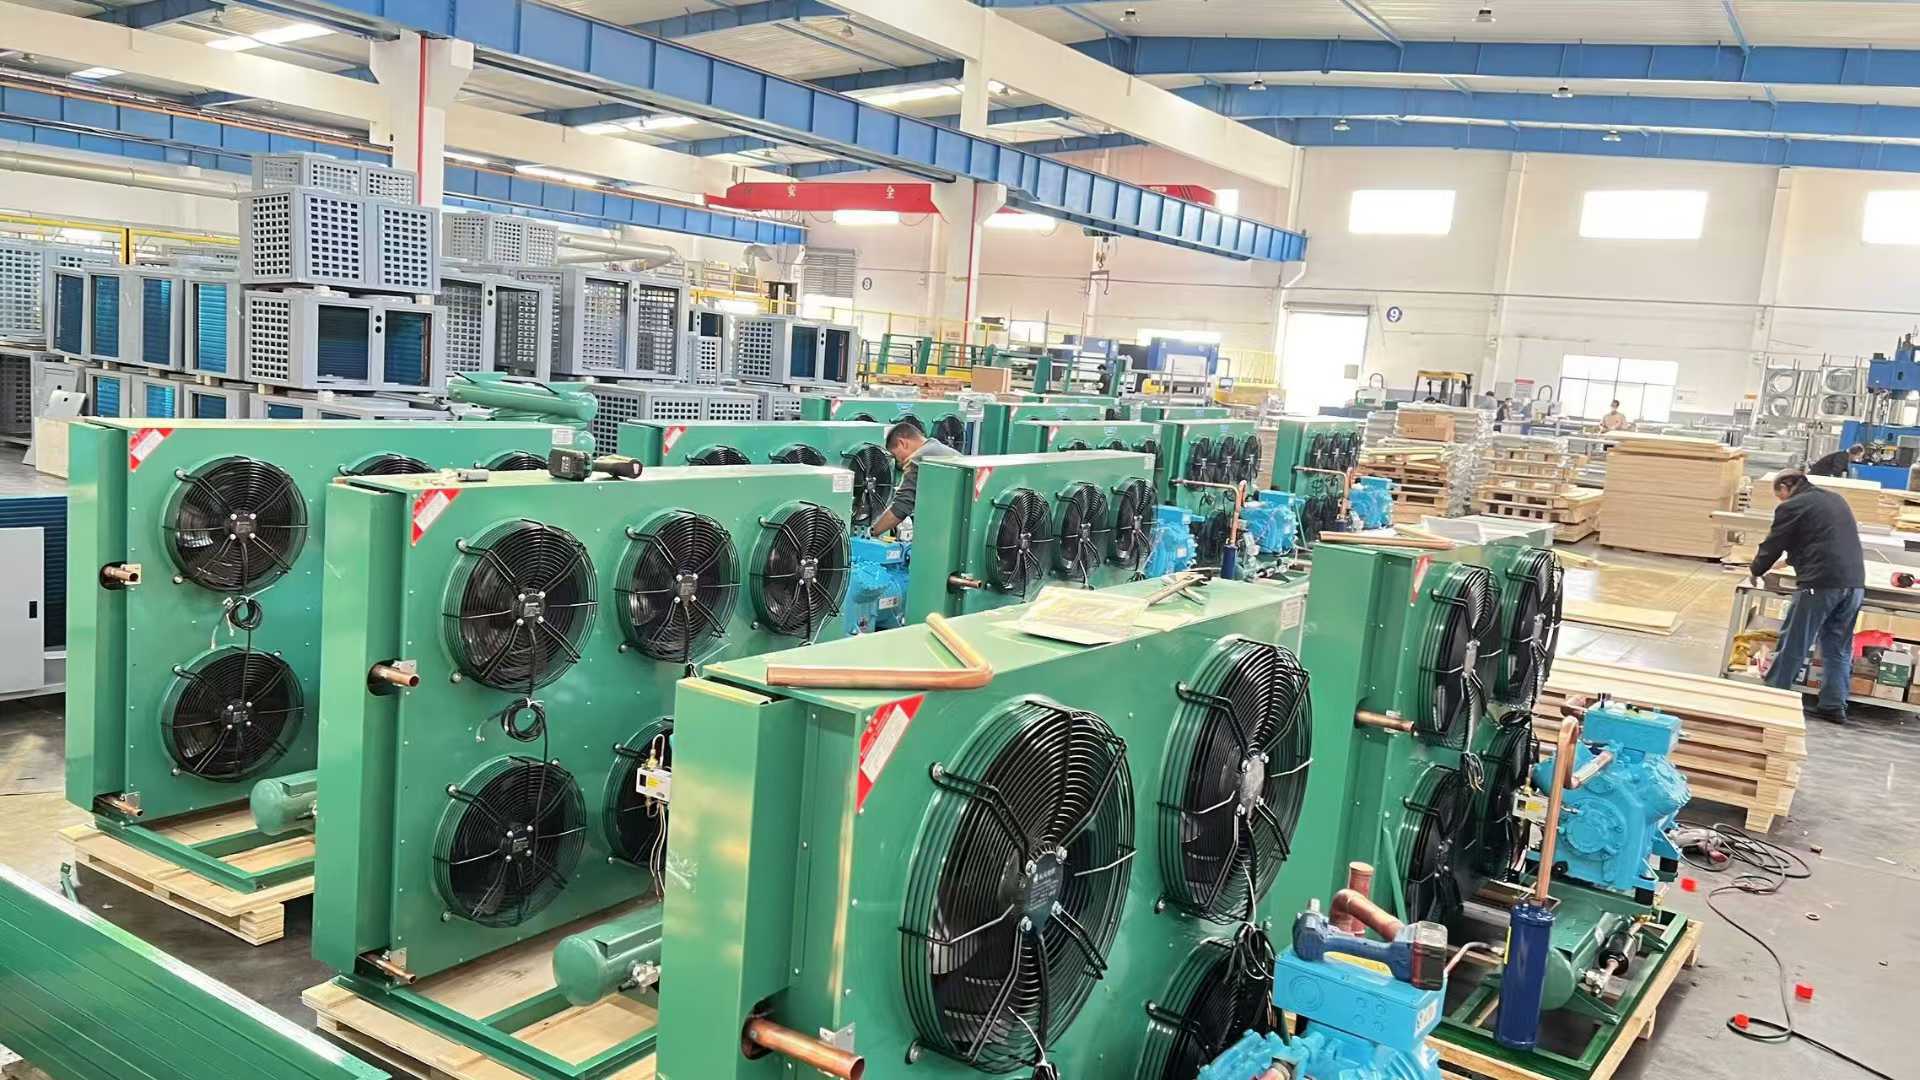
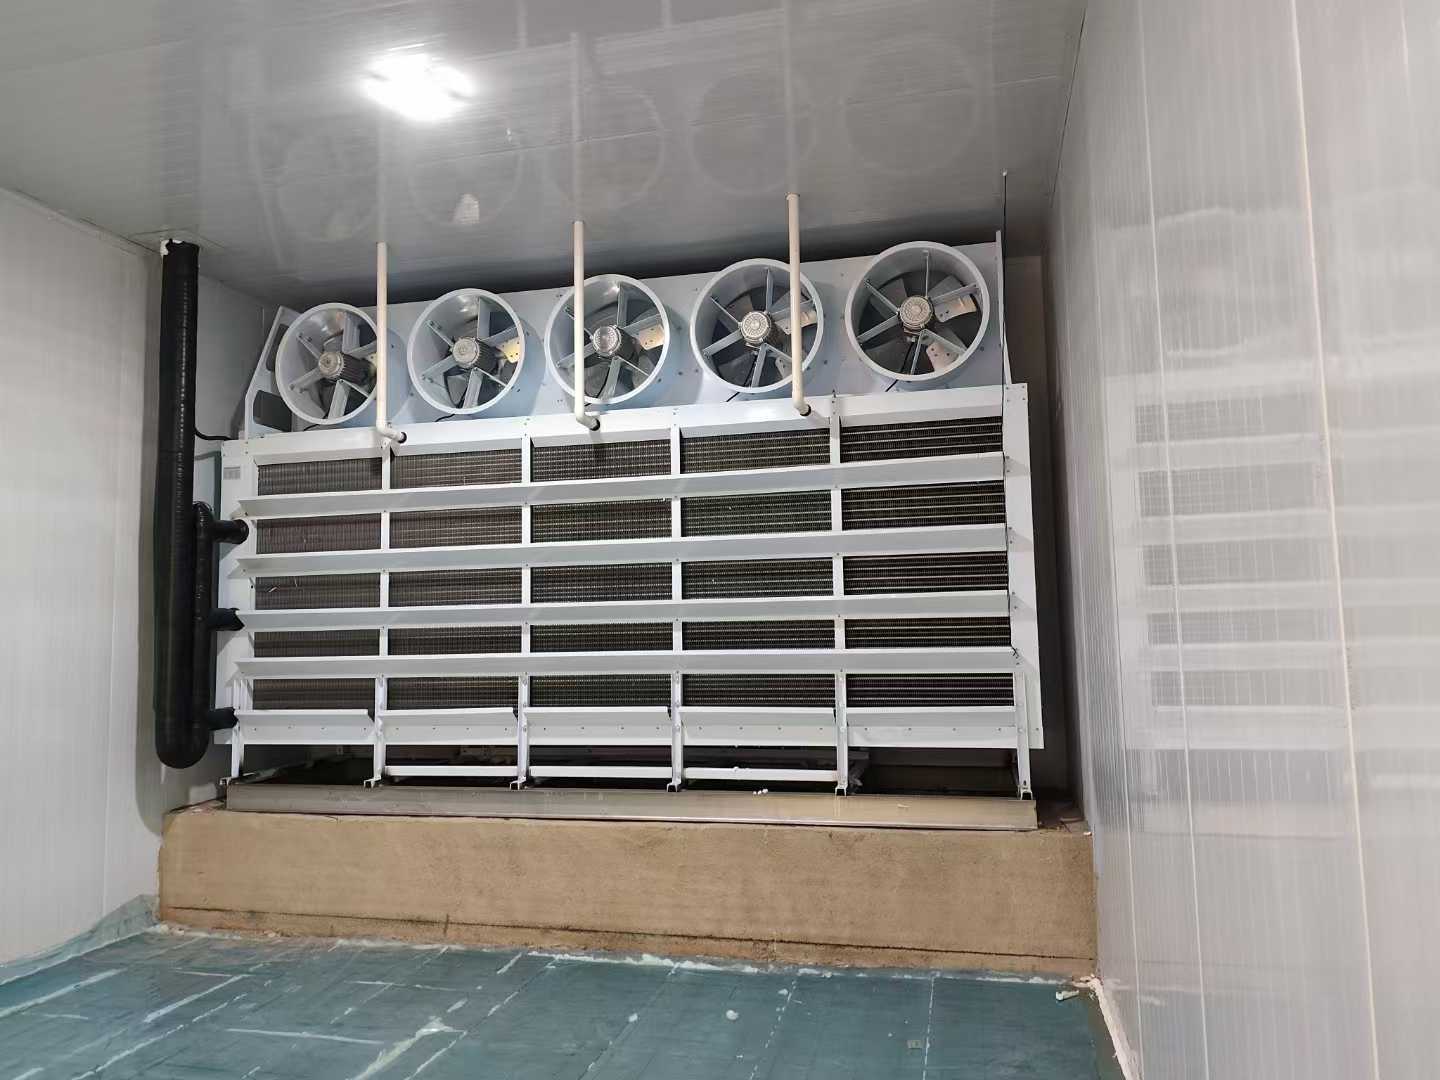
Industrial and commercial refrigeration systems—including cold storage, display cabinets, and process freezers—are critical for product preservation and operational continuity. Their inefficiency risks high energy costs and production disruptions. Below are 16 streamlined strategies to optimize performance, supported by data and visual references:

Maintain industry-specific temperatures (-18°C to -22°C for freezers; 2°C to 8°C for pharmaceuticals) to avoid overcooling. Data: A 3°C deviation below optimal settings increases compressor load by 30% (see Figure 1: Temperature vs. Energy Consumption Correlation). Use digital controls to keep fluctuations within ±1°C, as shown in the temperature stability chart for calibrated systems.
Reduce heat load by pre-cooling goods to within 5°C of storage temperatures before 入库. Chart Reference: Figure 2 compares cooling rates: vacuum pre-coolers lower produce temperatures 3x faster than ambient cooling (e.g., 25°C to 5°C in 45 minutes vs. 135 minutes). This cuts system startup strain by 40%.
Ensure 80cm aisles, 1.5m clearance from evaporators, and 30cm wall gaps. Data Visualization: Thermal mapping (Figure 3) shows proper spacing improves temperature uniformity by 40%, reducing localized overcooling zones (from 12% to 5% of total volume).
Weekly checks of door gaskets prevent cold loss. Performance Data: When air velocity at gaps exceeds 0.2m/s, cold loss increases by 22% (Figure 4: Gasket Integrity vs. Cold Retention). Silicone lubrication extends seal life 3x (average 5 years vs. 1.7 years for unmaintained seals).
Defrost when frost reaches 5mm—beyond this thickness, heat exchange efficiency drops by 25% (Figure 5: Frost Thickness Impact on Coefficient of Performance). Use combined hot gas/electric systems; limit cycles to 30 minutes to avoid temperature spikes exceeding 3°C.
Monthly cleaning of coils (water-cooled) and fins (air-cooled) boosts heat dissipation by 30%. Before/After Data: In food processing plants, dust accumulation over 3 months reduces condenser efficiency by 18% (Figure 6: Cleaning Interval vs. Heat Transfer Rate).
Position units 1.5m from heat sources (ovens, sunlight). Energy Savings: Adding 10cm insulation for adjacent hot zones cuts energy use by 15% (Figure 7: Proximity to Heat Sources vs. Energy Consumption).
Install auto-closers and air curtains to reduce cold loss by 40%. Usage Metrics: Sensor-activated doors limit open time to 8 seconds (vs. 22 seconds for manual doors), as tracked in Figure 8: Door Open Duration by Control Type.
WMS and RFID systems reduce door openings by 30% (from 12 to 8 times/hour in busy warehouses). Efficiency Gain: Correlates to 12% lower energy use (Figure 9: Door Operations vs. Cold Loss).
Clogged drains increase defrost cycles by 2x. Preventive Data: Weekly checks reduce downtime incidents by 75% (Figure 10: Maintenance Frequency vs. Drainage Failures).
LED lighting cuts energy use by 70% (12W vs. 40W incandescent). Low-E glass on display cases reduces heat ingress by 25% (Figure 11: Glass Type vs. Heat Gain).
Quarterly calibration maintains accuracy within ±0.5°C. Impact: Improves efficiency by 10% compared to annual calibration (Figure 12: Calibration Frequency vs. Temperature Accuracy).
Airtight wrapping reduces evaporator frosting by 20% (Figure 13: Packaging Type vs. Frost Accumulation Rate). Breather-valve containers lower moisture-related load by 15%.
Separate temperature zones cut energy use by 25% versus single-zone setups (Figure 14: Energy Consumption Comparison by System Design).
Monthly inspections and semi-annual overhauls reduce failures by 60% (Figure 15: Maintenance Regimen vs. Failure Rate) and extend equipment life by 5–8 years.
Retire units over 15 years (industrial) or 10 years (commercial). Lifecycle Data: ENERGY STAR models and CO₂ systems cut long-term costs by 40% (Figure 16: Equipment Age vs. Total Ownership Cost).

These data-backed measures balance performance and sustainability, delivering tangible cost savings and operational reliability across industrial and commercial refrigeration applications.

 07.30, 2025

